BigBrain Background
What is BigBrain?
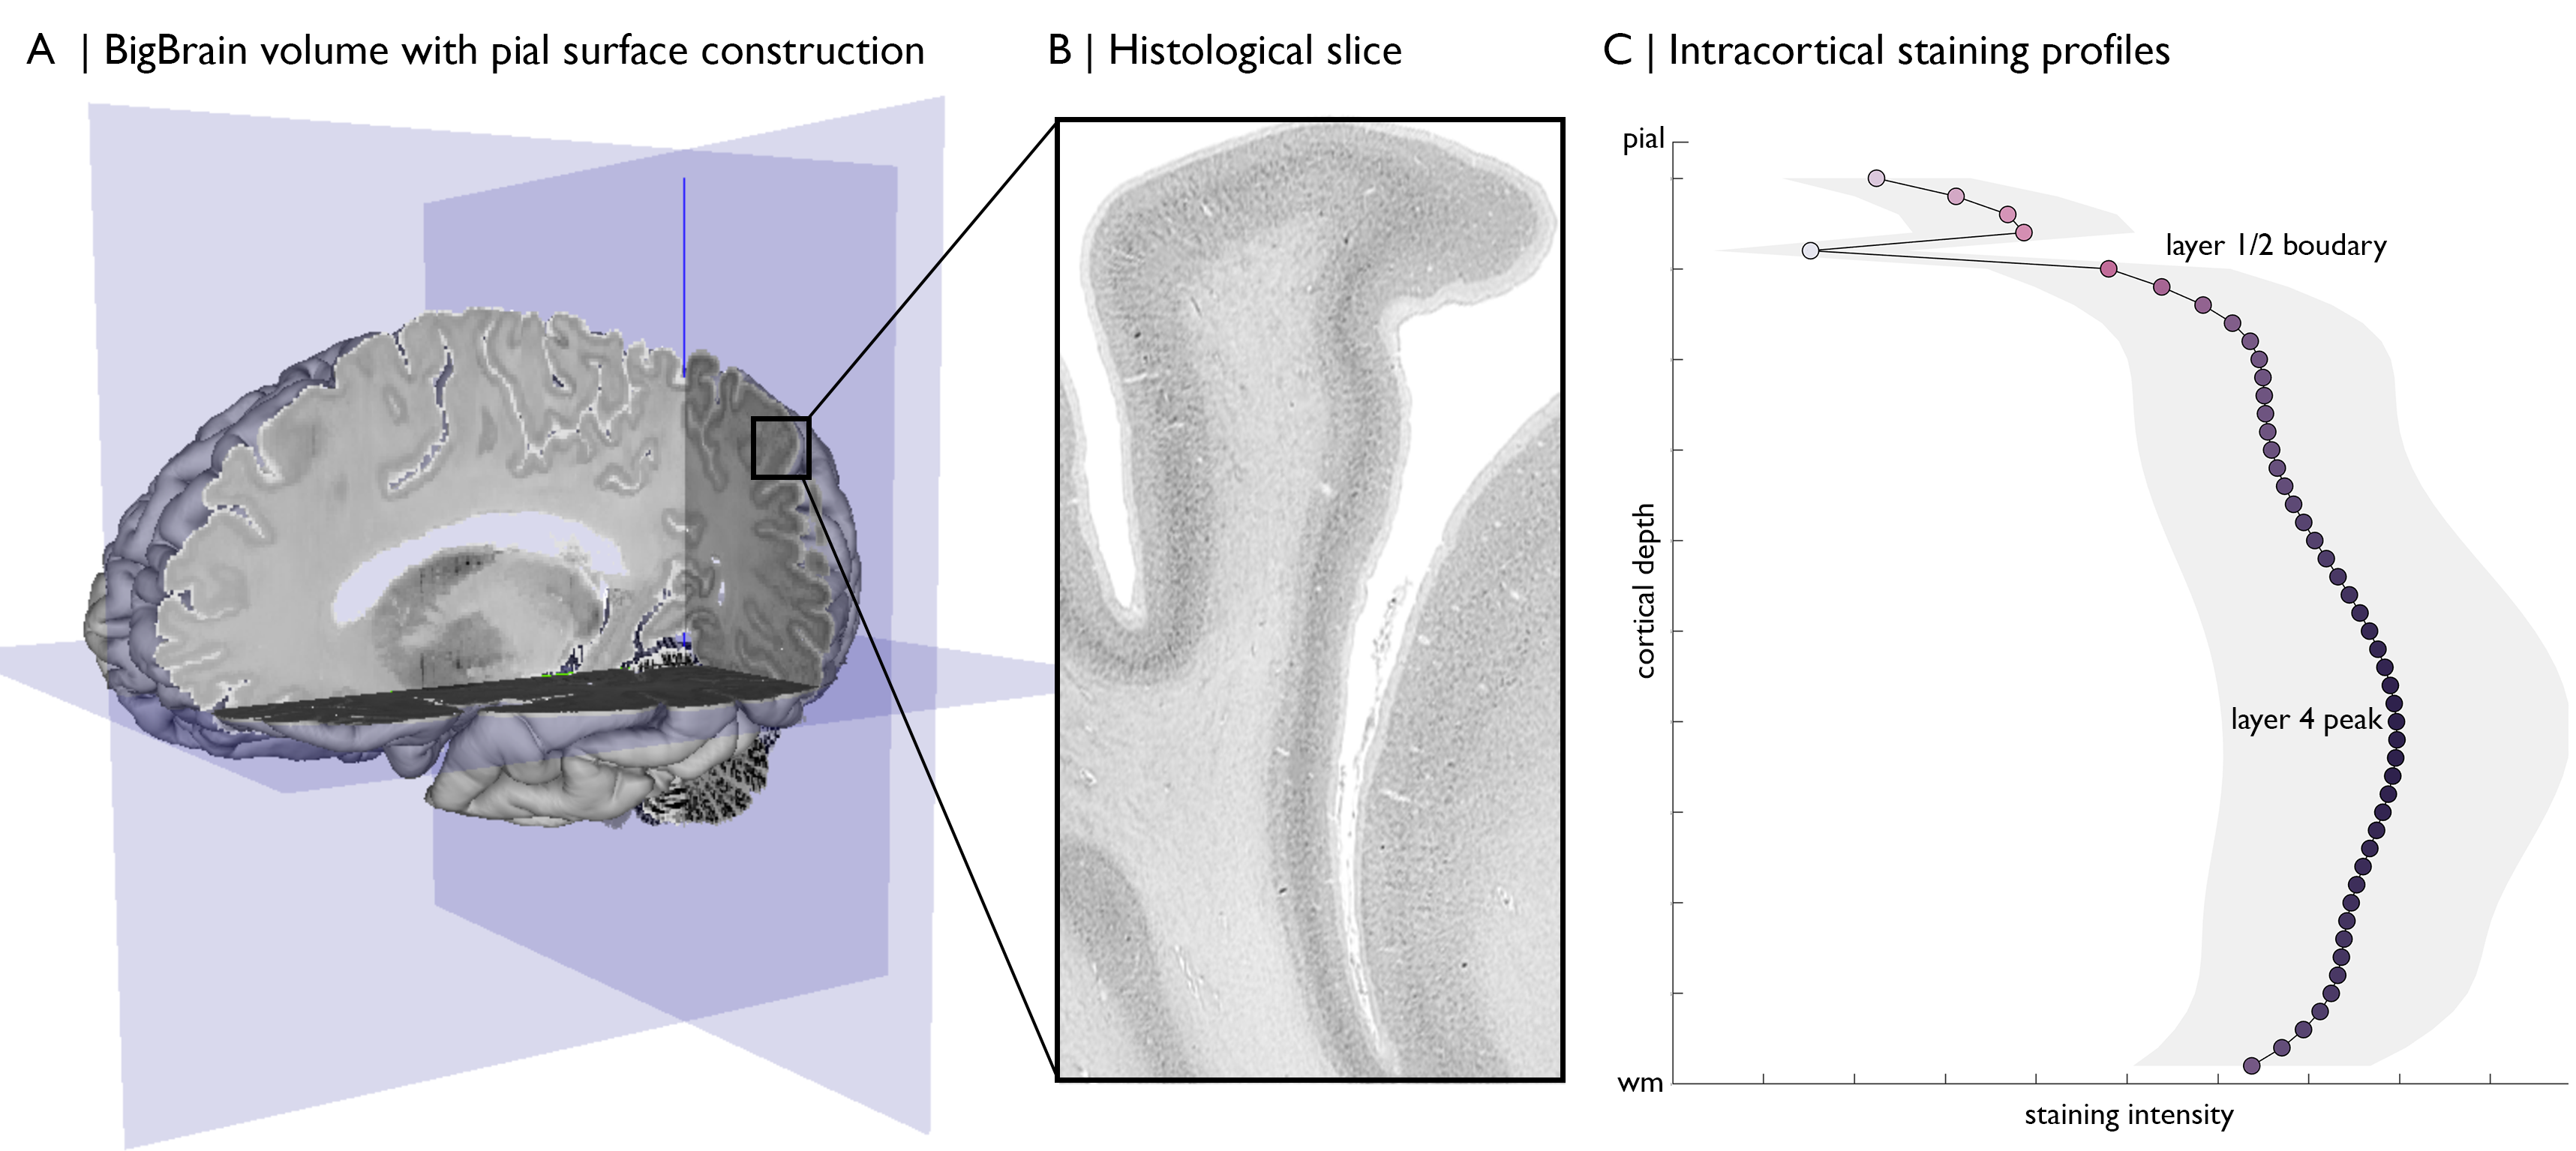
“An ultrahigh-resolution three-dimensional (3D) model of a human brain at nearly cellular resolution of 20 micrometers, based on the reconstruction of 7404 histological sections.” (Amunts et al., 2013). In essence, this allows investigation of variations in cell staining across one entire human brain.
How is the BigBrain data provided?
The data is released via https://bigbrain.loris.ca/main.php. Images of the histological slices are available at 20µm resolution, however, the huge benefit of this dataset for computational neuroscientists comes with the reconstruction of these slices into a 3D brain. The 40µm versions are released as blocks, whereas lower resolutions are provided as a single volume. These are available in minc or nifti formats, which makes for smooth integration with neuroimaging tools. Additionally, grey and white matter cortical surfaces were reconstructed with great precision for BigBrain. These surfaces contain 163842 vertices per hemisphere, which are aligned between grey and white matter surfaces. Since then, a number of additional surface reconstructions have been published from which we may attain a range of metrics. These are either incorporated in the BigBrain repository or available through the publication.
| Surfaces | Use for … | Reference |
|---|---|---|
| Grey and white (isocortex) | Initialisation and visualisation | Amunts et al., 2013 |
| Layer 1/2 boundary & Layer 4 | Boundary conditions | Wagstyl et al., 2018 |
| Equivolumetric | Staining intensity profiles | Waehnert et al., 2014 |
| Six layers | Laminar thickness | Wagstyl et al., 2020 |
| Hippocampus | Initialisation and visualisation | DeKraker et al., 2019 |
| Mesiotemporal confluence | Initialisation and visualisation | Paquola et al., 2020 |
How can I interpret the intensity values in the BigBrain volumes?
Merker staining (ie: that used in BigBrain) is a form of silver impregnation for cell bodies that produces a high contrast of black pigment in cells on a virtually colourless background (Merker, 1983). Stained histological sections were digitized at 20µm, resulting in greyscale images with darker colouring where many or large cells occur. The density and size of cells varies across cortical depths and areas, thus capturing the regional differentiation of cytoarchitecture. To explore these variations computationally, we create staining intensity profiles (Figure C). One widely adopted involves equivolumetric surface construction, whereby the surfaces are initialised at equidistant depths, then modulated by the curvature of the cortex (Waehnert et al., 2014). This holds advantages for histological data because laminae vary in thickness depending on curvature of the cortex (Bok, 1929). For the present purpose, we generate equivolumetric surfaces between the grey and white matter surfaces, then sample the intensity values along matched vertices in direction of cortical columns. You can find pre-generated staining intensity profiles using 50 intracortical surfaces and the 100µm BigBrain volume in the repository **BigBrainWarp/spaces/bigbrain/profiles.txt**. You can also create your own using sample_intensity_profiles.sh.